Matplotlib-Beispiel
Matplotlib stellt Daten in Figuren (Figures) dar, d.h. in Fenstern, Jupyter-Widgets usw., von denen jede eine oder mehre Achsen (Axes) enthalten kann. Die einfachste Möglichkeit, eine Figur mit Achsen zu erstellen, ist die Verwendung von pyplot.subplots um dann mit Axes.plot einige Daten anzugeben.
Import
[1]:
import matplotlib.pyplot as plt
Figur mit Achsen erstellen
[2]:
fig, ax = plt.subplots()
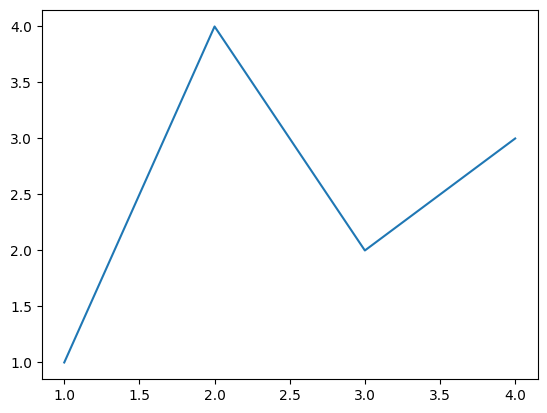
Einige Daten auf den Achsen zeichnen
[3]:
fig, ax = plt.subplots()
ax.plot([1, 2, 3, 4], [1, 4, 2, 3])
[3]:
[<matplotlib.lines.Line2D at 0x11b315350>]