Pandas-Beispiele
Importe
[1]:
import numpy as np
import pandas as pd
Scatter matrix
Mit pandas.plotting.scatter_matrix lässt sich eine Streumatrix (Scatter-Matrix erstellen, z.B.:
[2]:
df = pd.DataFrame(np.random.randn(1000, 4), columns=["A", "B", "C", "D"])
pd.plotting.scatter_matrix(df, alpha=0.2)
[2]:
array([[<Axes: xlabel='A', ylabel='A'>, <Axes: xlabel='B', ylabel='A'>,
        <Axes: xlabel='C', ylabel='A'>, <Axes: xlabel='D', ylabel='A'>],
       [<Axes: xlabel='A', ylabel='B'>, <Axes: xlabel='B', ylabel='B'>,
        <Axes: xlabel='C', ylabel='B'>, <Axes: xlabel='D', ylabel='B'>],
       [<Axes: xlabel='A', ylabel='C'>, <Axes: xlabel='B', ylabel='C'>,
        <Axes: xlabel='C', ylabel='C'>, <Axes: xlabel='D', ylabel='C'>],
       [<Axes: xlabel='A', ylabel='D'>, <Axes: xlabel='B', ylabel='D'>,
        <Axes: xlabel='C', ylabel='D'>, <Axes: xlabel='D', ylabel='D'>]],
      dtype=object)
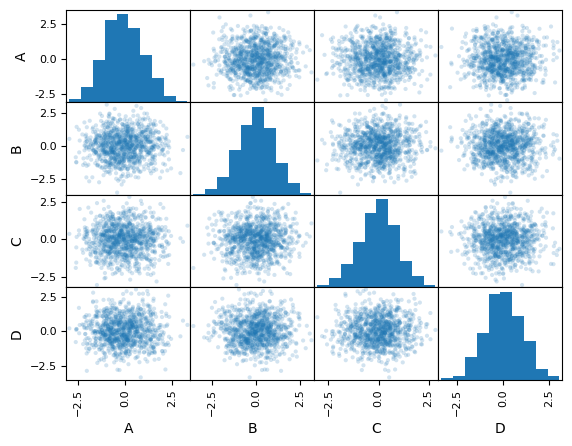
numpy.random.randn gibt eine Stichprobe (oder mehrere Stichproben) mit Standardnormalverteilung zurück. Die Parameter (d0, d1, …, dn) sind optionale Ganzzahlen, die die Dimensionen des zurückgegebenen Arrays bestimmen.
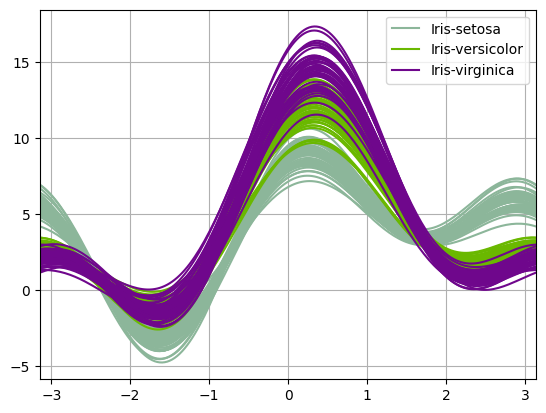
Andrews plot
In den letzten Jahren kamen weitere ausgefeilte statistische Visualisierungswerkzeuge hinzu, unter anderem Andrews plot für die Visualisierung mehrdimensionaler Daten:
[3]:
df = pd.read_csv(
    "https://raw.githubusercontent.com/pandas-dev/pandas/master/pandas/tests/io/data/csv/iris.csv"
)
pd.plotting.andrews_curves(df, "Name")
[3]:
<Axes: >